Data science & big-data analytics

Make structures in high-dimensional data visible and interpretable.

Your challenge

Large datasets and many measurements make it difficult to see what matters. Relevant groups, outliers and differences remain hidden in tables and simple charts.

How IAP approaches it

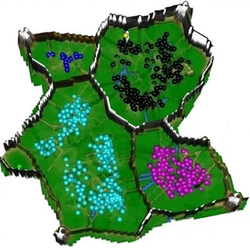
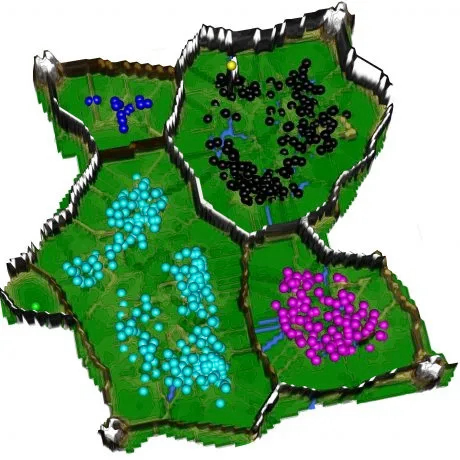
IAP makes similarities and differences accessible through projection, clustering and databionic self-organisation. A topographic representation of gene-expression profiles with 7,500 measurements each shows how complex data can be interpreted together with domain experts.

Project deliverables

You receive visualisations of groups, outliers and differences in your data, interpreted together with your experts. The analysis identifies which features merit further investigation for classification or forecasting.

Read the technical detail ↓

Methods and technical detail

Make 7,500 measurements per patient interpretable

In the example shown, each point represents a gene-expression profile with 7,500 dimensions. Swarm intelligence searches for structure without using diagnosis labels. Similar profiles occupy valleys; ridges expose differences between groups. The landscape can also be represented as a three-dimensional model.

Separate discovery from interpretation

Known diagnoses are colour-coded for subsequent interpretation. Their agreement with the discovered groups shows which diagnostic distinctions are represented in the measurements. This examines the structure and meaning of the data before a classifier is applied.

Use outliers to guide expert review

Two atypical cases in the example warrant closer examination of diagnosis and data quality. Such evidence helps experts investigate measurement problems, rare cases or unsuitable assignments.

Methodological sources

Stier, Q., Hoffmann, J. & Thrun, M. C. (2026). Classifying with the Fine Structure of Distributions: Leveraging Distributional Information for Robust and Plausible Naïve Bayes. Machine Learning and Knowledge Extraction (MAKE), 8(1), 13. MDPI.

Uses fine distributional structure to provide a robust and interpretable classification baseline. The implementation supports parallel computation across multiple processor cores with shared memory.

Thrun, M. C. & Märte, J. (2026). Memshare: Memory Sharing for Multicore Computation in R with an Application to Feature Selection by Mutual Information using PDE. The R Journal, 17(4), 306–322.

Shared memory for parallel computation in R, demonstrated through feature selection in high-dimensional gene-expression data.

Thrun, M. C. & Ultsch, A. (2021). Swarm intelligence for self-organized clustering. Artificial Intelligence, 290, 103237. Elsevier.

DatabionicSwarm uses swarm intelligence and self-organisation to discover groups and structures in high-dimensional data. Clustering follows similarities and density differences in the data without requiring predefined classes.

Topographic representation of gene-expression data
Example from IAP’s work: profiles with 7,500 dimensions shown as a landscape. Colours show diagnoses for subsequent interpretation; structure is identified without these labels.

Projects related to this service

Universitätsklinikum & Philipps-Universität Marburg

Hospital prototype · collaborative research

Sample quality and high-dimensional biomedical data

The quality of blood and bone-marrow samples affects interpretation. Dilution and complex cell populations need to be considered in the analysis.

Project details →
Allview.com

Collaborative project · Proof of Concept (PoC)

Interpretable rules for stock selection

Company fundamentals were to support systematic stock selection that people could inspect.

Project details →
LANCOM Systems

Data analysis · further method development

Web and CRM data for sales analysis

How does use of a company website relate to later project enquiries? The analysis for LANCOM Systems examined browsing behaviour alongside associated project information.

Project details →

The right form of handover

Option 1

Prototype for your IT team

IAP investigates the problem, develops and evaluates the approach, and hands over the agreed prototype with documentation. Your IT team takes responsibility for further product development and operation.

Option 2

Application through integration

IAP develops the agreed application, including its interface and integrations, connects it to the intended workflow, and completes acceptance and handover. Your organisation or operating partner takes responsibility for subsequent operation.

Which decision do you want to improve?

In a free, non-binding 20-minute introductory discussion, we clarify your objective, starting point and a useful next step.

Request an introductory discussion